Back to all projects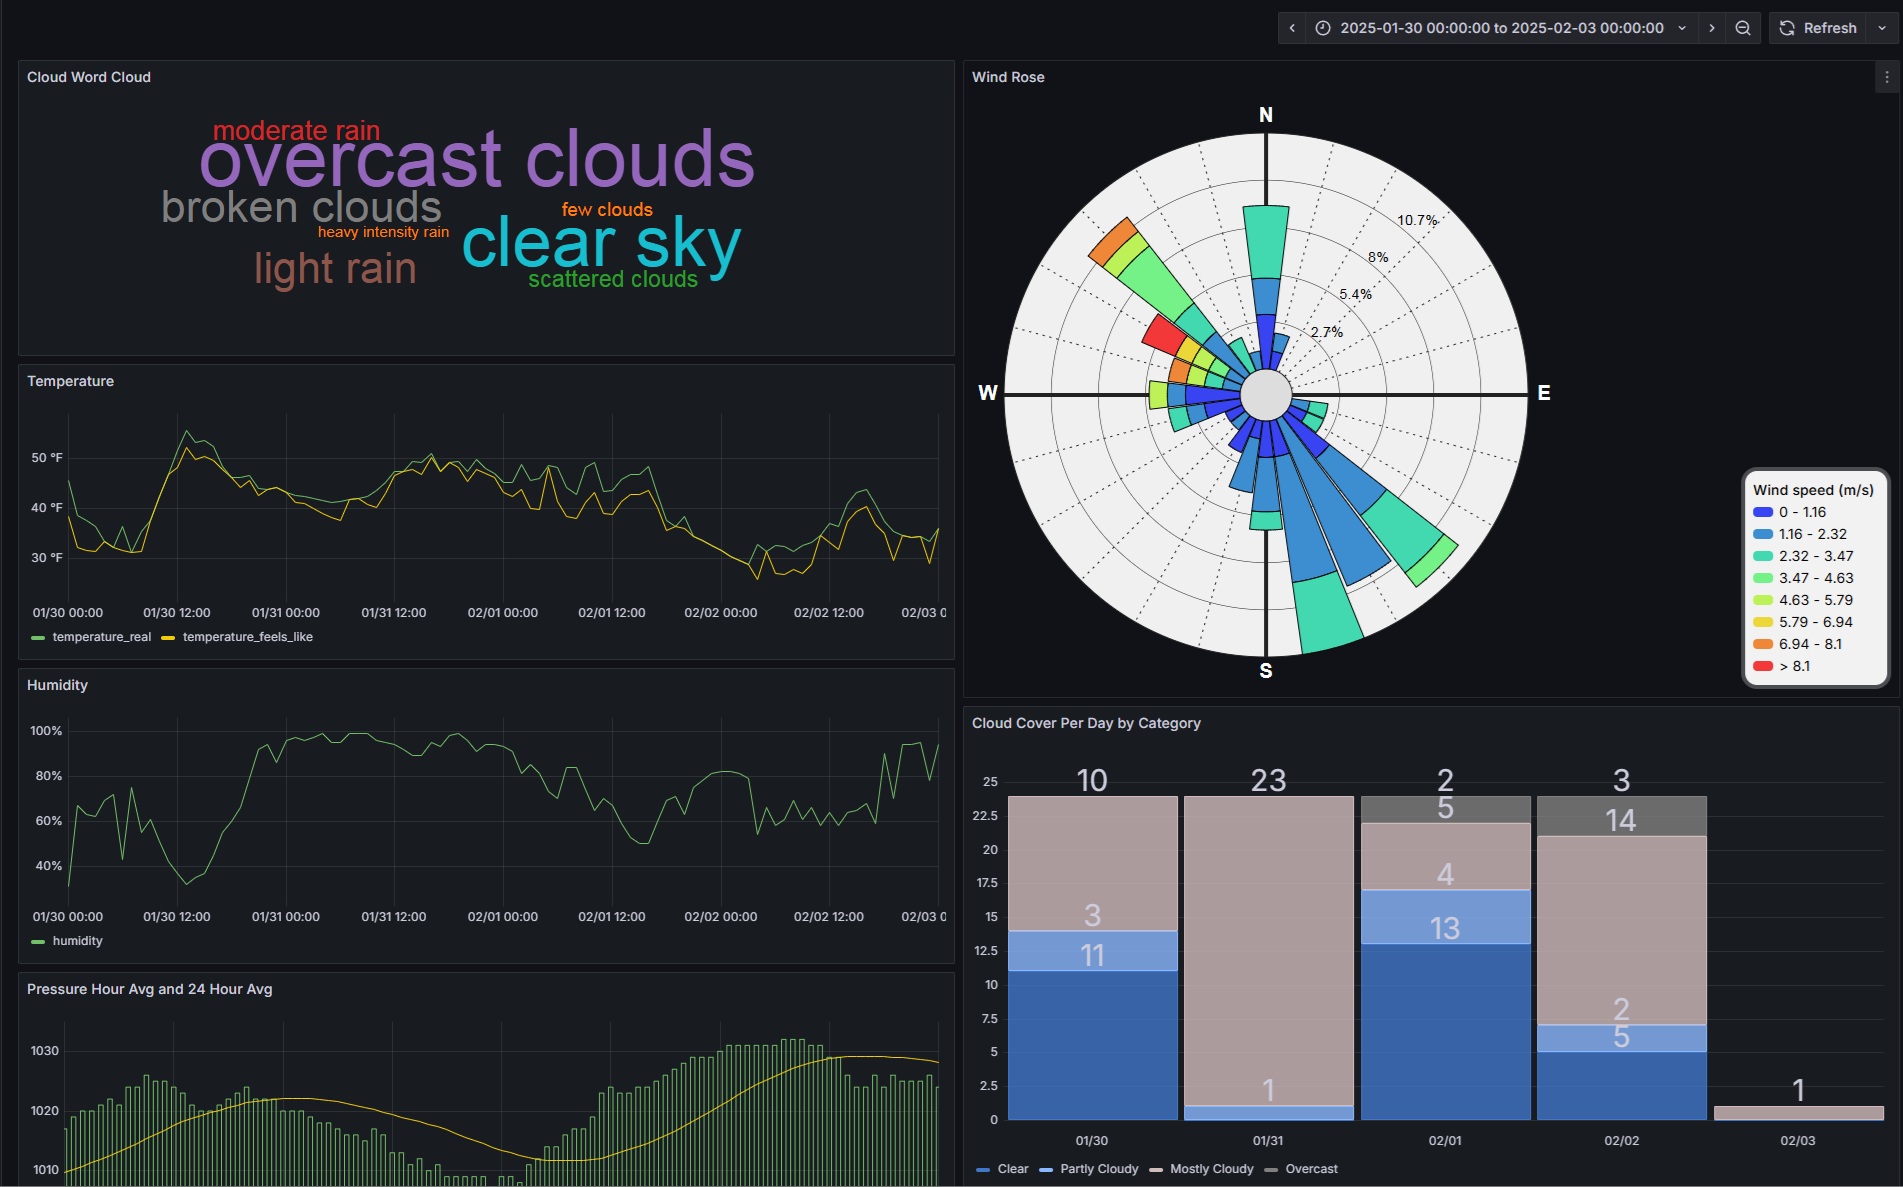

Grafana Dashboards
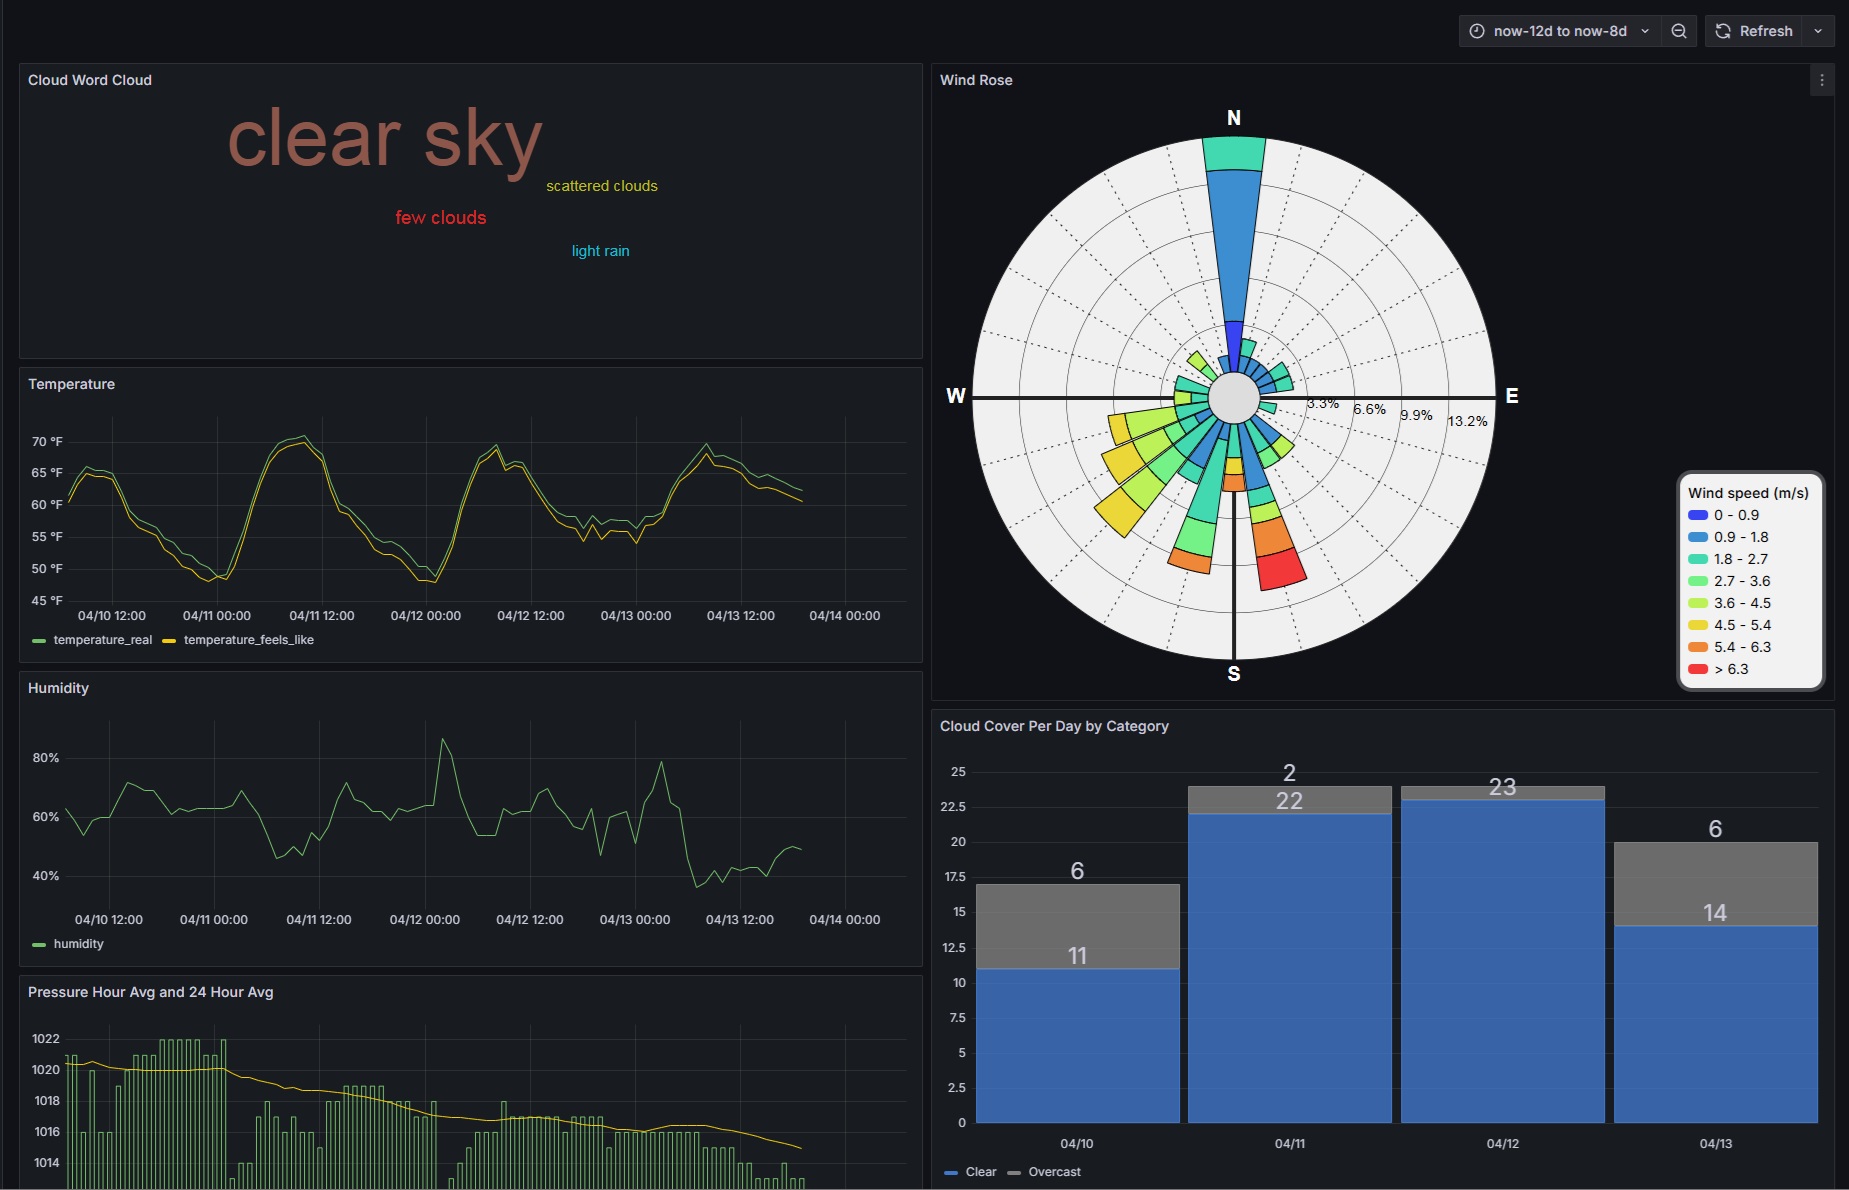
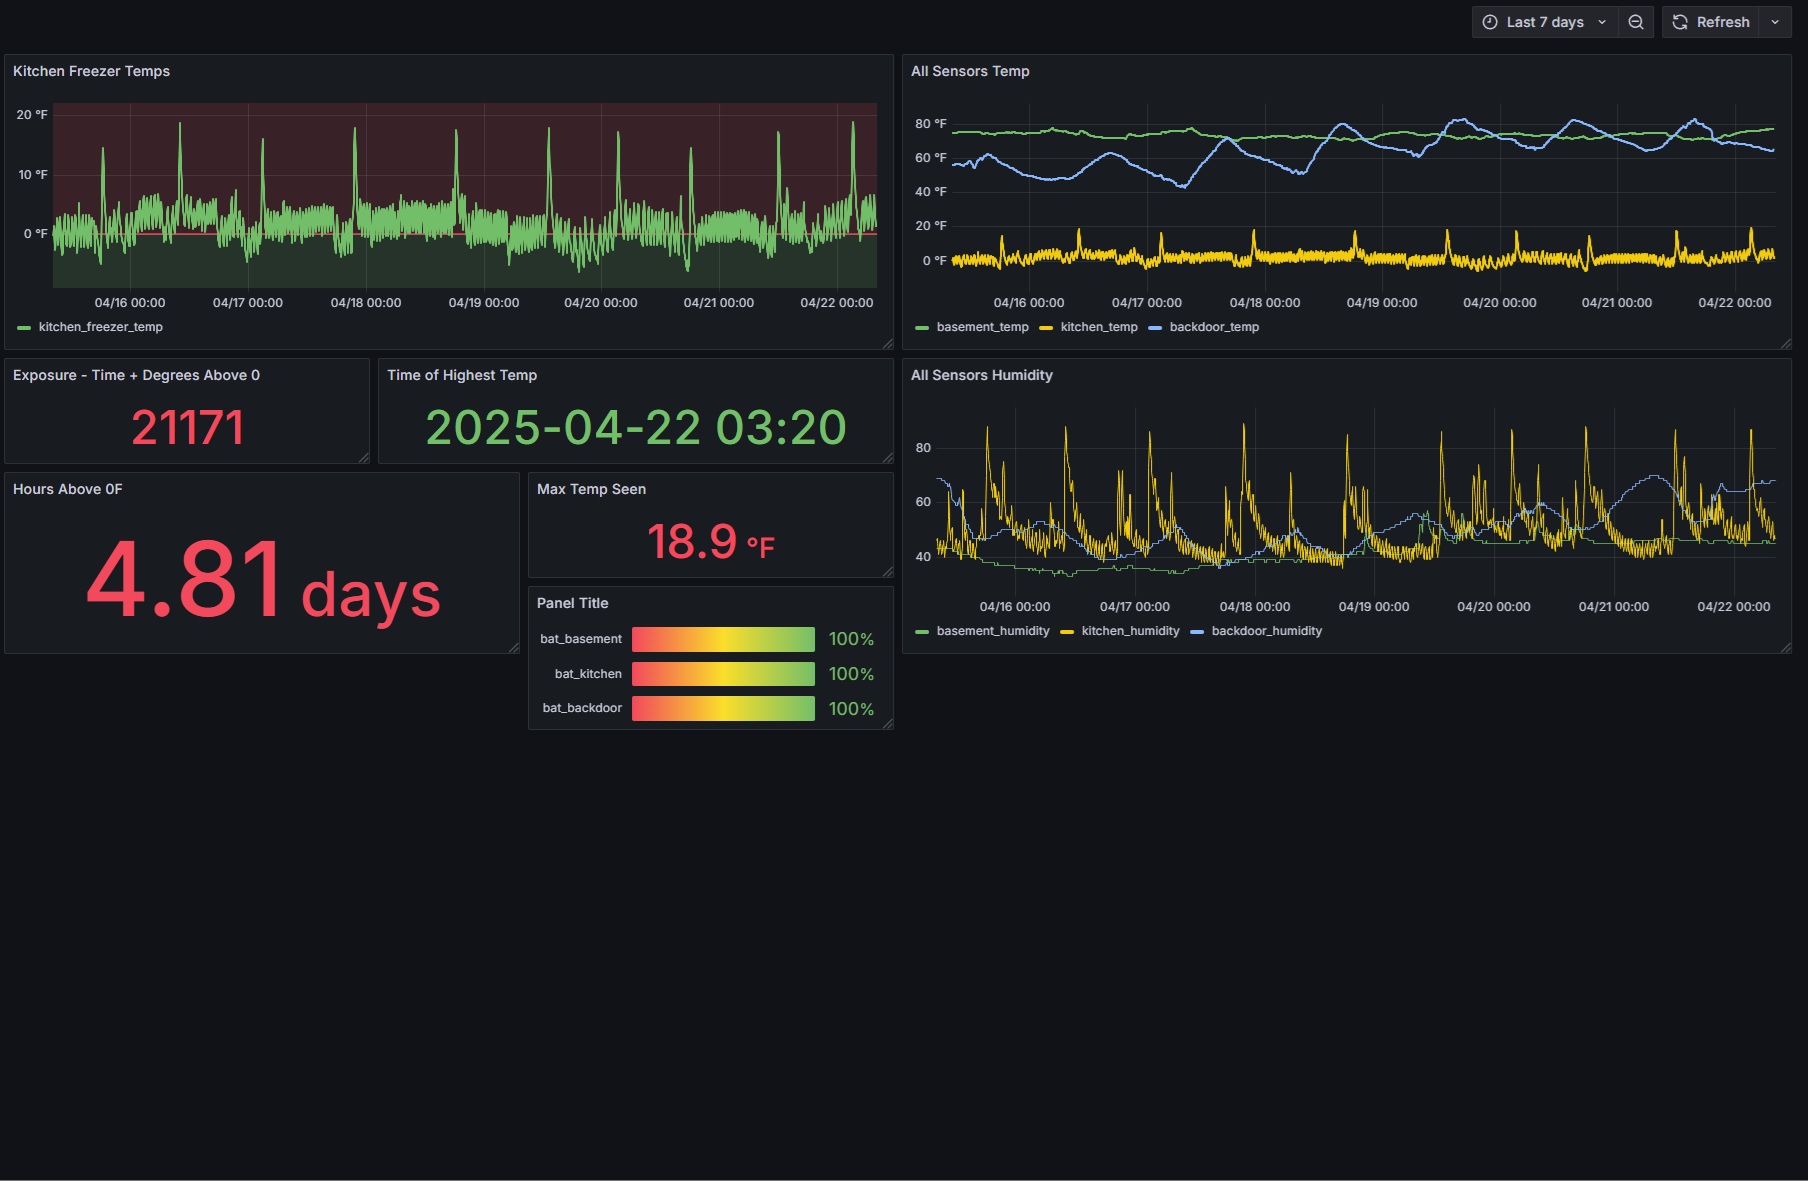
This project involves creating specialized Grafana dashboards for monitoring and visualizing various types of archaeological and environmental data.
The dashboards integrate data from multiple sources including field sensors, weather APIs, and database records to provide comprehensive real-time monitoring.
Custom visualizations were developed to represent archaeological-specific data in meaningful ways, helping researchers identify patterns and correlations.
The system includes automated alerts and reporting features to notify team members of significant changes or conditions requiring attention.
Project Details
Technologies
GrafanaPostgreSQLPrometheusJavaScriptData Visualization
Category
Monitoring
Date
2025